

From invisibleto indexed in 90 days.
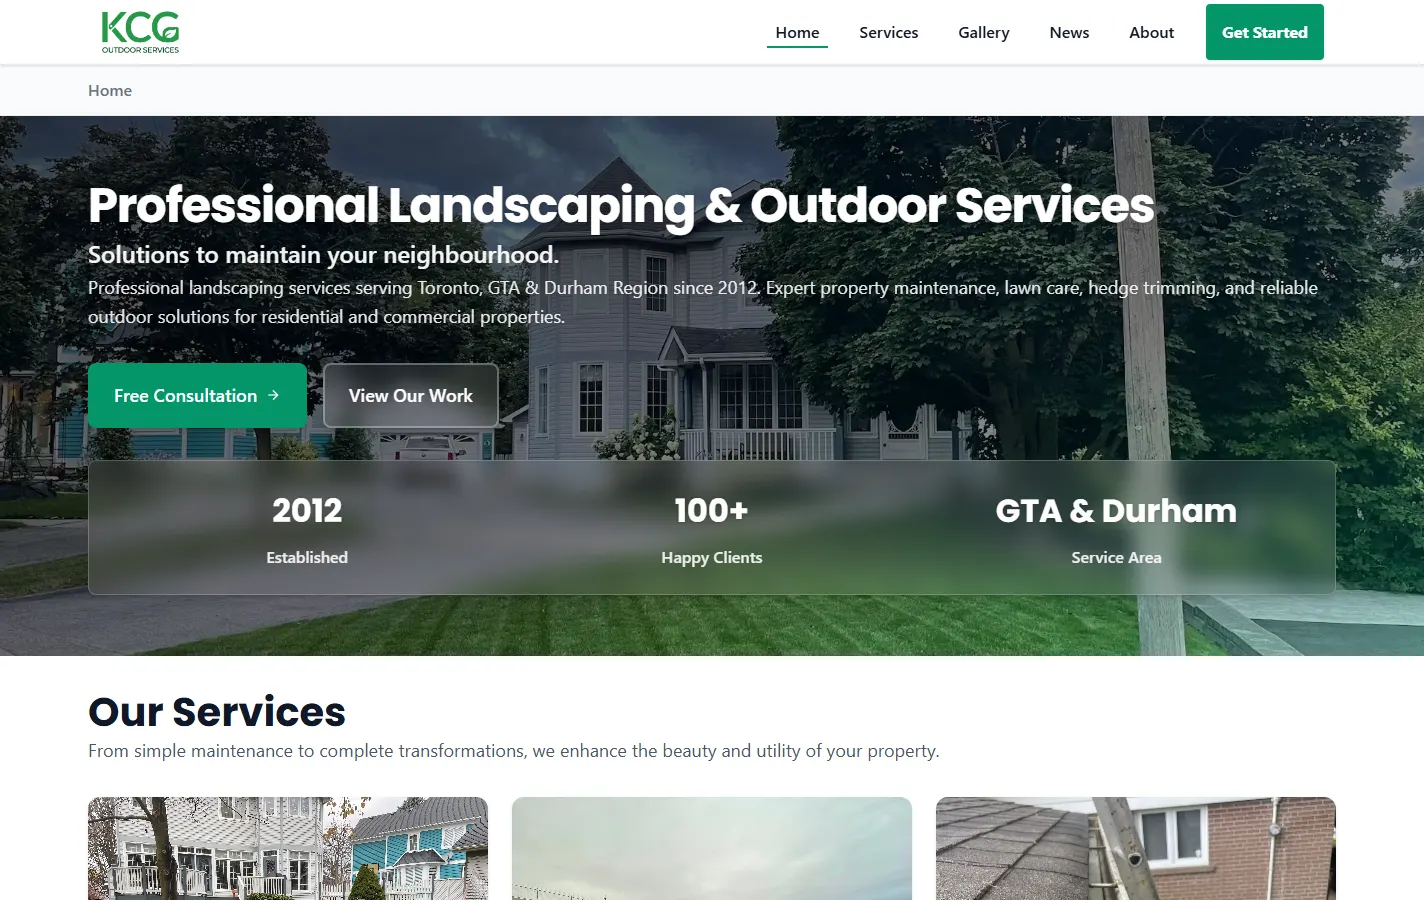
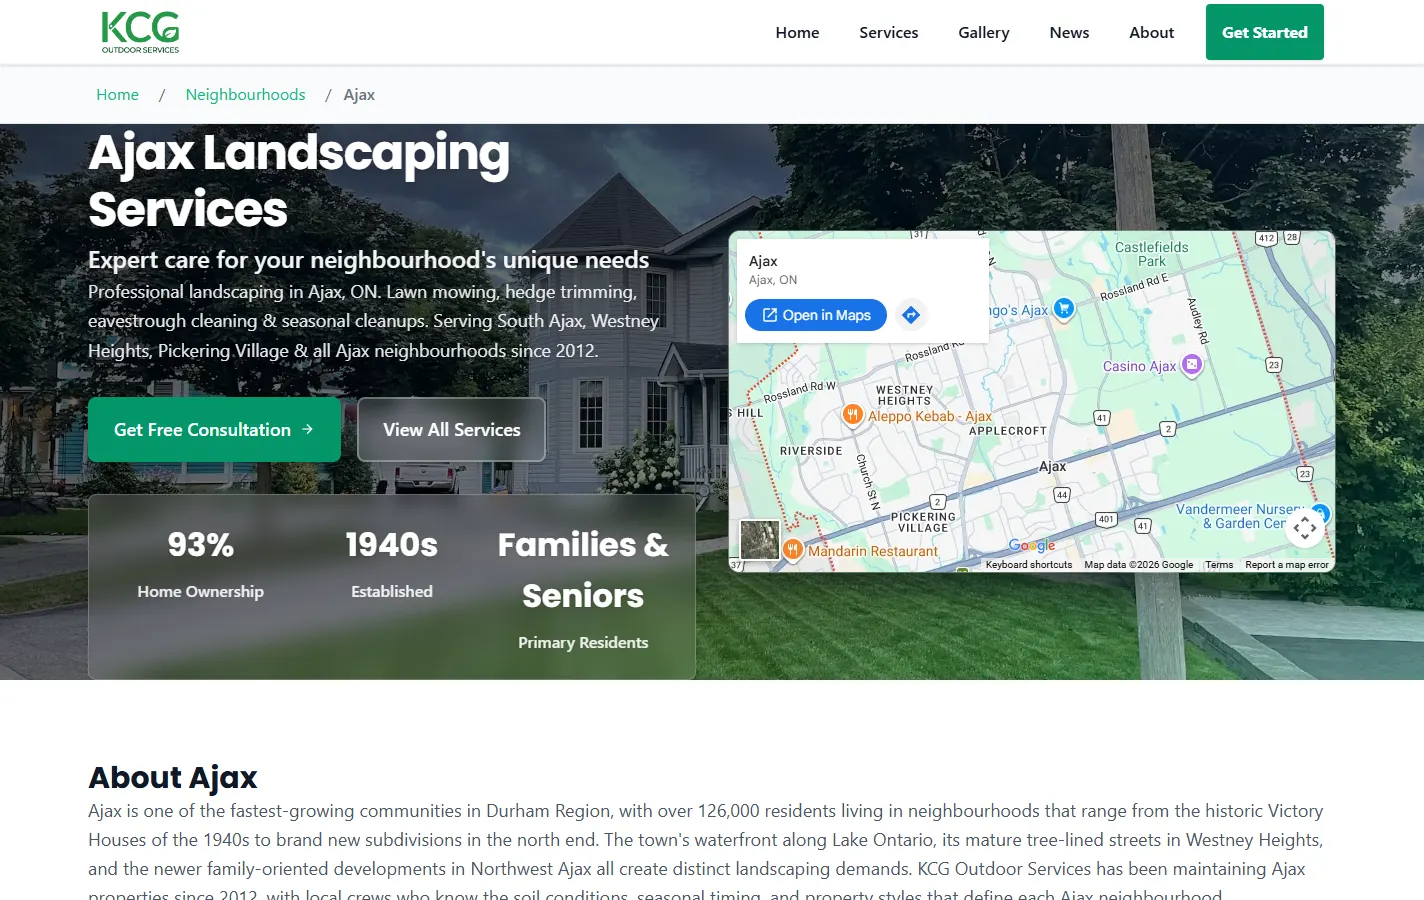
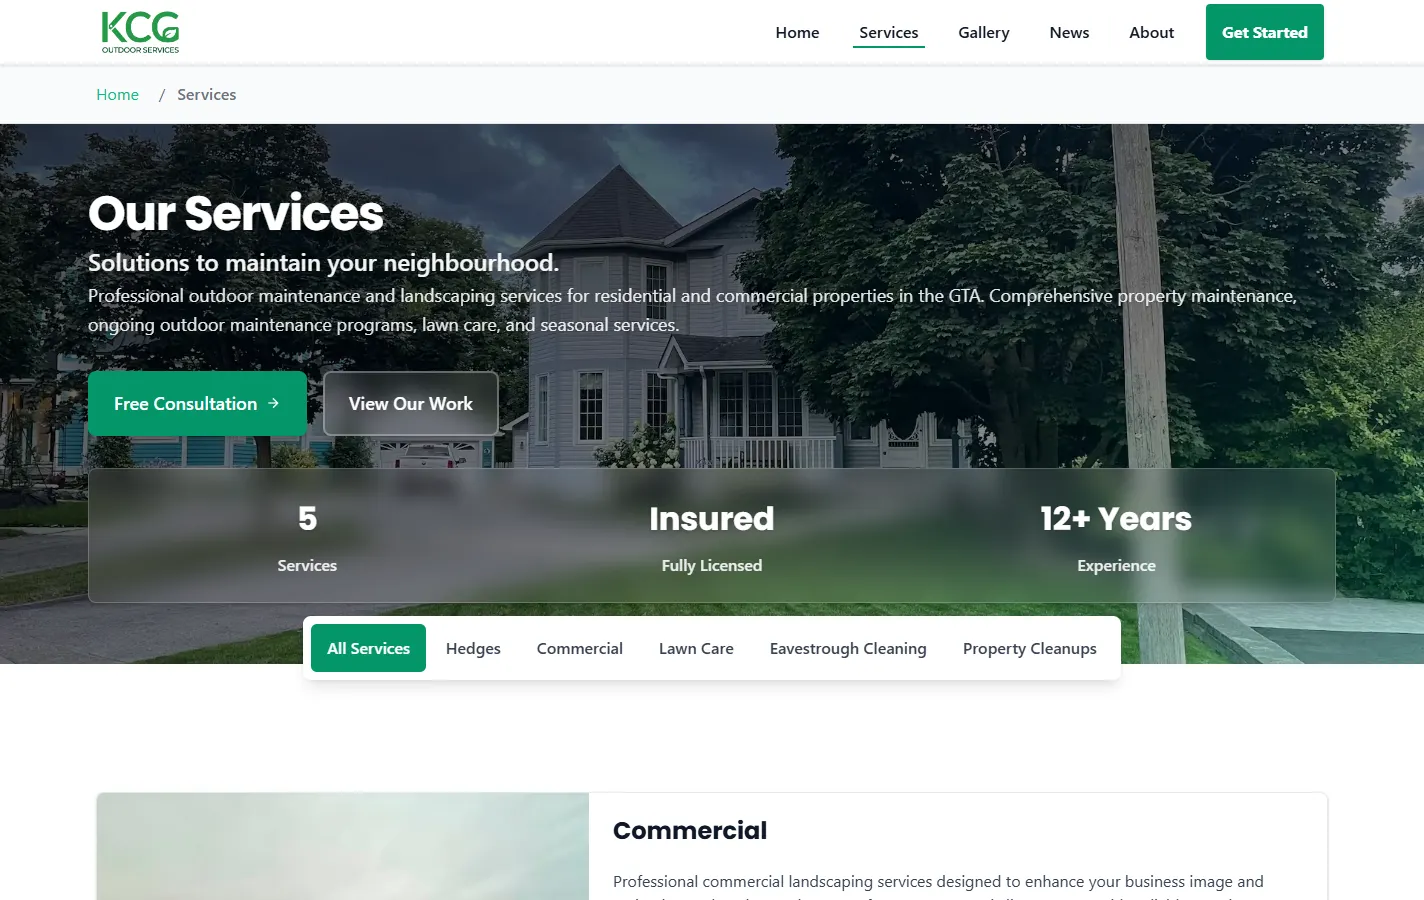
Built KCG’s first-ever website from scratch: a professional digital presence with self-management, neighbourhood-targeted landing pages for local SEO, and showcases for services and projects.
- Client
- KCG Outdoor Services
- Sector
- Landscaping
- Work
- First website + local SEO
- Year
- 2025
- Stack
- Static site · Headless CMS · Edge hosting
The situation
KCG had zero web presence: a service-area business losing local searches to competitors with even mediocre sites. Word-of-mouth had a ceiling, and quoting jobs over text was eating evenings.
They needed a credibility-establishing website, but more than that: a lead engine that showed up in local search for every neighbourhood they served.
What we built
A site that doubles as a sales rep.
01
Foundation
A static marketing site with self-managed content, so KCG can update it without calling anyone.
02
Local SEO
Neighbourhood-targeted landing pages, schema markup for every service, Google Business sync. They now own their service-area searches.
Results
Month by month, from zero.
Every figure comes from Google Search Console for kcgoutdoorservices.ca, refreshed on 17 August 2026 and covering through 16 August 2026. Jul 2026 is the last closed month; the current one is hatched and excluded from every total.
Impressions per month
How often the site appeared in search results. This is the reach the rest depends on.
| Month | impressions |
|---|---|
| Apr 2025 | 0 |
| May 2025 | 130 |
| Jun 2025 | 21 |
| Jul 2025 | 43 |
| Aug 2025 | 110 |
| Sep 2025 | 155 |
| Oct 2025 | 867 |
| Nov 2025 | 1973 |
| Dec 2025 | 1929 |
| Jan 2026 | 2775 |
| Feb 2026 | 2878 |
| Mar 2026 | 4180 |
| Apr 2026 | 3833 |
| May 2026 | 4627 |
| Jun 2026 | 6181 |
| Jul 2026 | 9463 |
| Aug 2026 (partial) | 5788 |
Clicks per month
Visits from search. Smaller than impressions by definition, and the number that has to move for reach to mean anything.
| Month | clicks |
|---|---|
| Apr 2025 | 0 |
| May 2025 | 19 |
| Jun 2025 | 6 |
| Jul 2025 | 3 |
| Aug 2025 | 31 |
| Sep 2025 | 21 |
| Oct 2025 | 16 |
| Nov 2025 | 9 |
| Dec 2025 | 1 |
| Jan 2026 | 2 |
| Feb 2026 | 13 |
| Mar 2026 | 18 |
| Apr 2026 | 28 |
| May 2026 | 32 |
| Jun 2026 | 33 |
| Jul 2026 | 53 |
| Aug 2026 (partial) | 15 |
Average position
Impression-weighted across every query. The axis is flipped so closer to #1 is higher. It gets worse through late 2025 on purpose: the site started ranking for hundreds of new terms it had never appeared for, which drags the average down before it pulls it up.
| Month | position |
|---|---|
| Apr 2025 | no data |
| May 2025 | 3.4 |
| Jun 2025 | 19.6 |
| Jul 2025 | 51.5 |
| Aug 2025 | 23.7 |
| Sep 2025 | 34.1 |
| Oct 2025 | 60.2 |
| Nov 2025 | 45.1 |
| Dec 2025 | 62.9 |
| Jan 2026 | 59.8 |
| Feb 2026 | 47.6 |
| Mar 2026 | 26.2 |
| Apr 2026 | 27.2 |
| May 2026 | 27.4 |
| Jun 2026 | 24.2 |
| Jul 2026 | 22.9 |
| Aug 2026 (partial) | 27.5 |
Source: Google Search Console Search Analytics · 44,953 impressions total
What this does not prove
- These are impressions, clicks and ranking positions from Google Search Console. They are not revenue, and they are not jobs won. We can show that far more people find KCG in search than did a year ago; what closes on a driveway is not something we can measure from here.
- Average position is impression-weighted across every query the site appears for, so it moves when the site starts ranking for many new terms, not only when existing terms improve. A rising impression count with a flat position is the normal shape of that, and it is what happened here through late 2025.
- Organic search was one part of the work, alongside the site build itself and a Google Business Profile. We are not claiming search alone produced the result.
- The most recent month is still accruing and is marked partial. It is excluded from every total and record on this page.
“TechCreations Labs helped us complete the full initial launch. Immediate and noticeable increase in ranking via major search engines and an uptick in organic traffic and lead creation.”